diff --git a/docs/usage/administration/understanding_synapse_through_grafana_graphs.md b/docs/usage/administration/understanding_synapse_through_grafana_graphs.md
new file mode 100644
index 0000000000..c365cc3923
--- /dev/null
+++ b/docs/usage/administration/understanding_synapse_through_grafana_graphs.md
@@ -0,0 +1,84 @@
+## Understanding Synapse through Grafana graphs
+
+It is possible to monitor much of the internal state of Synapse using [Prometheus](https://prometheus.io)
+metrics and [Grafana](https://grafana.com/).
+A guide for configuring Synapse to provide metrics is available [here](../../metrics-howto.md)
+and information on setting up Grafana is [here](https://github.com/matrix-org/synapse/tree/master/contrib/grafana).
+In this setup, Prometheus will periodically scrape the information Synapse provides and
+store a record of it over time. Grafana is then used as an interface to query and
+present this information through a series of pretty graphs.
+
+Once you have grafana set up, and assuming you're using [our grafana dashboard template](https://github.com/matrix-org/synapse/blob/master/contrib/grafana/synapse.json), look for the following graphs when debugging a slow/overloaded Synapse:
+
+## Message Event Send Time
+
+
+
+This, along with the CPU and Memory graphs, is a good way to check the general health of your Synapse instance. It represents how long it takes for a user on your homeserver to send a message.
+
+## Transaction Count and Transaction Duration
+
+
+
+
+
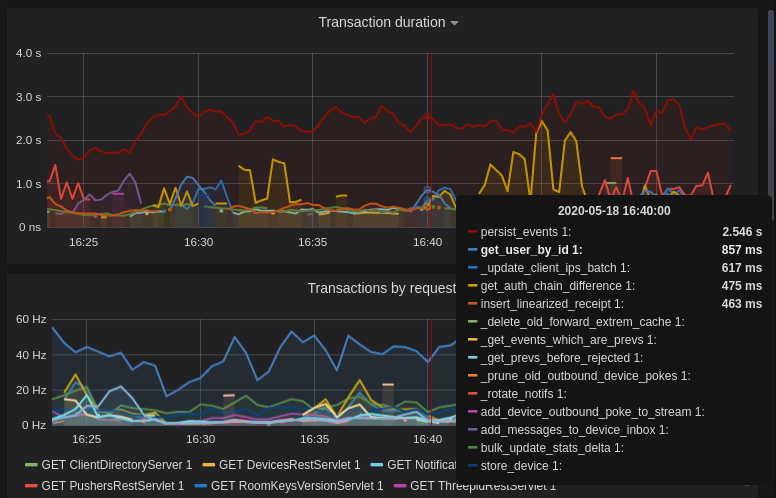
+These graphs show the database transactions that are occurring the most frequently, as well as those are that are taking the most amount of time to execute.
+
+
+
+In the first graph, we can see obvious spikes corresponding to lots of `get_user_by_id` transactions. This would be useful information to figure out which part of the Synapse codebase is potentially creating a heavy load on the system. However, be sure to cross-reference this with Transaction Duration, which states that `get_users_by_id` is actually a very quick database transaction and isn't causing as much load as others, like `persist_events`:
+
+
+
+Still, it's probably worth investigating why we're getting users from the database that often, and whether it's possible to reduce the amount of queries we make by adjusting our cache factor(s).
+
+The `persist_events` transaction is responsible for saving new room events to the Synapse database, so can often show a high transaction duration.
+
+## Federation
+
+The charts in the "Federation" section show information about incoming and outgoing federation requests. Federation data can be divided into two basic types:
+
+- PDU (Persistent Data Unit) - room events: messages, state events (join/leave), etc. These are permanently stored in the database.
+- EDU (Ephemeral Data Unit) - other data, which need not be stored permanently, such as read receipts, typing notifications.
+
+The "Outgoing EDUs by type" chart shows the EDUs within outgoing federation requests by type: `m.device_list_update`, `m.direct_to_device`, `m.presence`, `m.receipt`, `m.typing`.
+
+If you see a large number of `m.presence` EDUs and are having trouble with too much CPU load, you can disable `presence` in the Synapse config. See also [#3971](https://github.com/matrix-org/synapse/issues/3971).
+
+## Caches
+
+
+
+
+
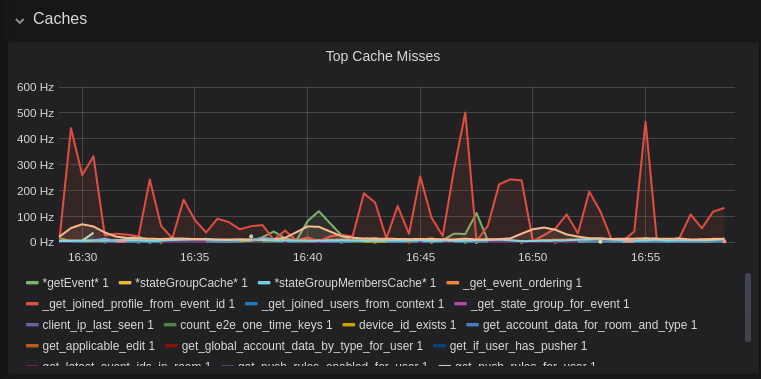
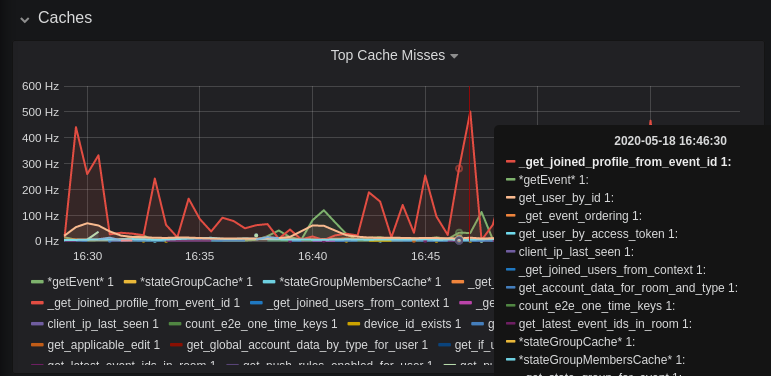
+This is quite a useful graph. It shows how many times Synapse attempts to retrieve a piece of data from a cache which the cache did not contain, thus resulting in a call to the database. We can see here that the `_get_joined_profile_from_event_id` cache is being requested a lot, and often the data we're after is not cached.
+
+Cross-referencing this with the Eviction Rate graph, which shows that entries are being evicted from `_get_joined_profile_from_event_id` quite often:
+
+
+
+we should probably consider raising the size of that cache by raising its cache factor (a multiplier value for the size of an individual cache). Information on doing so is available [here](https://github.com/matrix-org/synapse/blob/ee421e524478c1ad8d43741c27379499c2f6135c/docs/sample_config.yaml#L608-L642) (note that the configuration of individual cache factors through the configuration file is available in Synapse v1.14.0+, whereas doing so through environment variables has been supported for a very long time). Note that this will increase Synapse's overall memory usage.
+
+## Forward Extremities
+
+
+
+Forward extremities are the leaf events at the end of a DAG in a room, aka events that have no children. The more that exist in a room, the more [state resolution](https://spec.matrix.org/v1.1/server-server-api/#room-state-resolution) that Synapse needs to perform (hint: it's an expensive operation). While Synapse has code to prevent too many of these existing at one time in a room, bugs can sometimes make them crop up again.
+
+If a room has >10 forward extremities, it's worth checking which room is the culprit and potentially removing them using the SQL queries mentioned in [#1760](https://github.com/matrix-org/synapse/issues/1760).
+
+## Garbage Collection
+
+
+
+Large spikes in garbage collection times (bigger than shown here, I'm talking in the
+multiple seconds range), can cause lots of problems in Synapse performance. It's more an
+indicator of problems, and a symptom of other problems though, so check other graphs for what might be causing it.
+
+## Final Thoughts
+
+If you're still having performance problems with your Synapse instance and you've
+tried everything you can, it may just be a lack of system resources. Consider adding
+more CPU and RAM, and make use of [worker mode](../../workers.md)
+to make use of multiple CPU cores / multiple machines for your homeserver.
+
|
